
How satellites detect fires, and what they miss
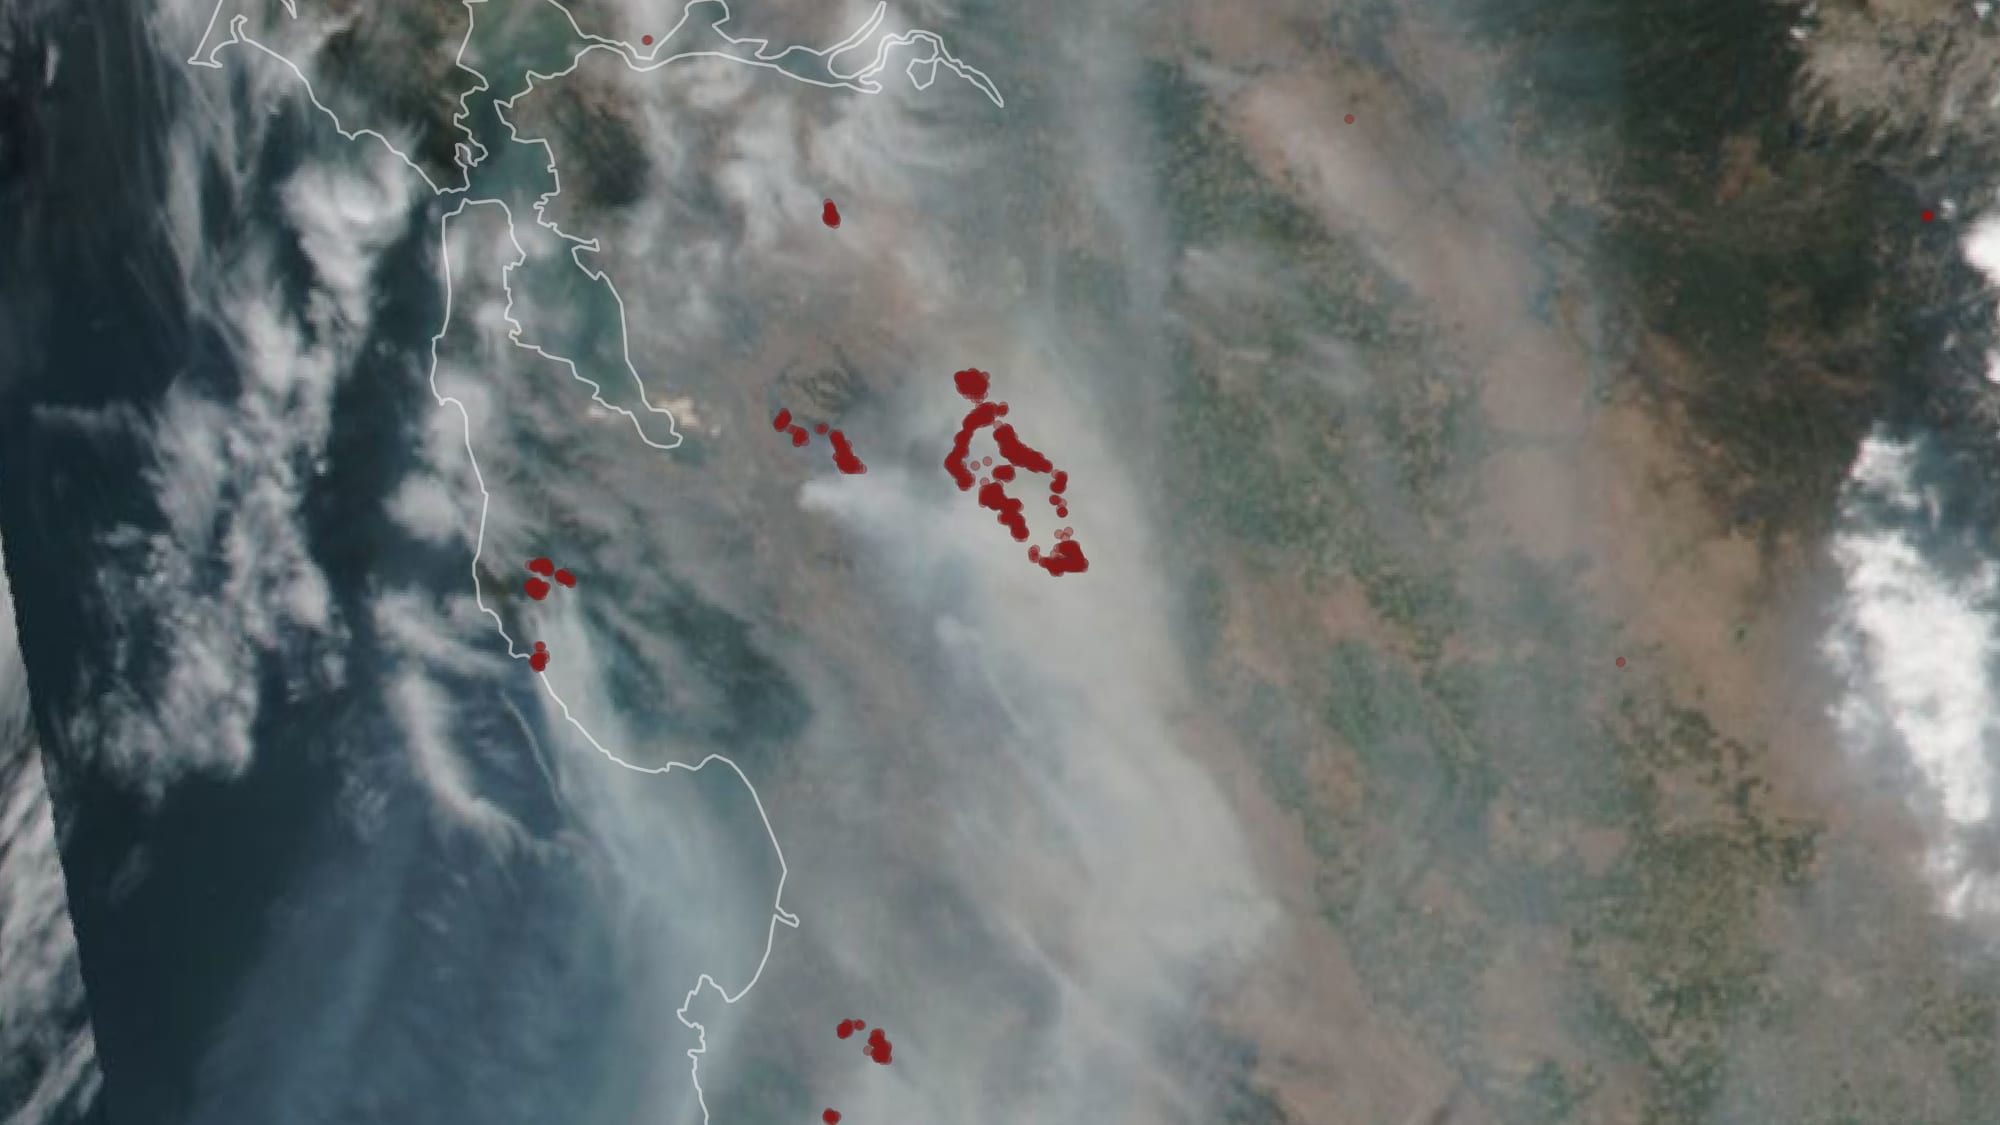
Maps such as NASA FIRMS and the European EFFIS show fires as red dots. The maps are free and useful, but they are easy to misread. This is a short explanation of what a dot means and what it does not.
The satellite measures heat, it does not see flames
Satellite sensors do not photograph a fire. They measure infrared radiation in two channels, around 4 and around 11 micrometres. Ground, rock and roofs warmed by the sun radiate most strongly around 11 µm. Flames are several hundred degrees hotter and radiate most strongly around 4 µm.
The difference is large. A surface at about 700 °C emits roughly 4,500 times more at 4 µm than ground at 27 °C, but only about 30 times more at 11 µm. That is why even a small fire pushes the 4 µm reading up sharply while barely changing the 11 µm one. The software then compares each part of the image with its surroundings and flags it as a fire if it is much hotter at 4 µm.
A dot is the centre of a pixel
The sensor divides the ground into squares called pixels. A VIIRS pixel is about 375 × 375 m, and a pixel from the older MODIS sensor about 1 × 1 km. Pixels grow towards the edge of the image: up to about 800 m for VIIRS and about 2 × 5 km for MODIS.
A dot on the map is the centre of a pixel in which at least one fire was found. It does not show where in the pixel the fire is or how big it is. MODIS routinely detects fires of about 1,000 m², which is a tenth of a hectare and only 0.1 % of its pixel. In one night-time experiment, VIIRS detected a campfire of about 5 m².
Three rules follow:
- A dot does not mean the whole square is burning.
- One larger fire can light up several neighbouring pixels, so the number of dots is not the number of fires.
- The total area of the pixels is not the burned area. Burned area is measured by other methods, from images taken after the fire.
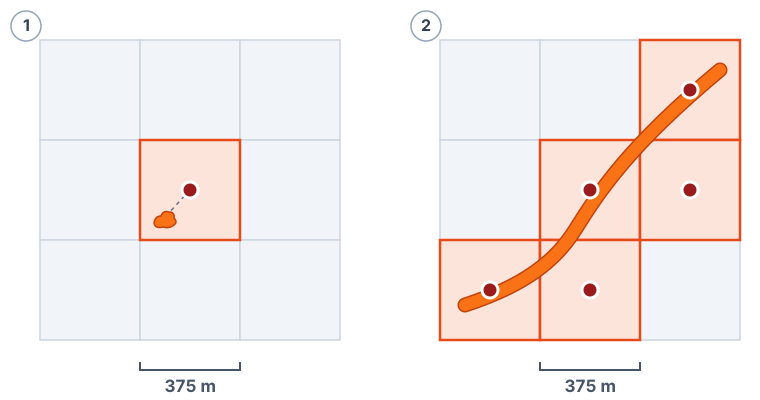
The pixel position is usually accurate to within 100 m, but in rare cases it can be off by several kilometres. At the edge of the image a MODIS dot can be more than two kilometres from the fire itself. In hilly terrain that can mean the other side of a ridge.
When the satellite passes
Most dots come from satellites in polar orbits, which pass over the same place only a few times a day. The main ones are NOAA-20 and NOAA-21, carrying VIIRS. They pass over any given place at about 13:30 and 01:30 local solar time, so the clock time differs from place to place, and from one pass to the next by an hour or more. Suomi NPP stops delivering data on 1 November 2026, and the Terra and Aqua satellites carrying MODIS end their missions during 2027.
Between two passes the satellite sees nothing. A fire that starts at 15:00 and is out by 20:00 may never appear on the map.
For most of the world the data are published within three hours of the pass. Faster data, in under half an hour, exist only for the United States and parts of Canada and Mexico. The time next to a dot is in UTC and marks when the image was taken, not when it was published. If a dot is labelled 11:35 UTC and local time is UTC+2, it was observed at 13:35 and may not have reached the map until about 16:35.
Geostationary satellites (GOES, Meteosat, Himawari) image the same part of the Earth every 10 to 15 minutes, but with pixels of 2 to 3 km directly below the satellite and larger further away. They therefore see only larger fires and make more mistakes.
Confidence and FRP
Each dot comes with two numbers that are often misread.
| Field | What it means |
|---|---|
| Confidence, VIIRS | low: weak heat contrast or sun glint; nominal: clear contrast without glint; high: the pixel is so hot that the sensor saturates |
| Confidence, MODIS | 0 to 100 %; below 30 low, 30 to 79 nominal, 80 and above high |
| FRP | fire radiative power of all fires in the pixel, in megawatts |
High confidence in VIIRS means the pixel is very hot, not that it is certainly a wildfire. FRP shows how intensely something is burning, not how large an area. Its uncertainty is about 50 %, and it says nothing about flame length or rate of spread.
False dots and missed fires
The algorithm rarely reports heat that is not there: in about 1 % of cases by day and almost never at night. But not every real heat source is a wildfire. Steelworks, cement plants, refineries and gas flares produce dots too, as does the burning of stubble and crop waste. FIRMS marks persistent heat sources in a separate map layer. EFFIS shows filtered dots, yet still warns that not every dot is a fire.
The opposite problem is far more common. In a large validation study, MODIS missed 86 % of the fires seen by a more detailed satellite, mostly small ones. It missed fewer than 10 % of the large fires. Satellites cannot see through cloud or thick smoke, and they rarely see a surface fire burning under a tree canopy.
No dot on the map does not mean no fire.
What the data are good for
Satellite data are good for an overview of a wider area and neighbouring areas, for following a large fire over several days, for checking whether something is still burning at night and for review after an incident. The night pass is especially useful, because the sensor is at its most sensitive and false dots are almost absent.
They do not replace a call to the emergency number. They do not tell you where to place crews, and they cannot confirm that a fire is out.